So if you’re betting on Tennis or your Betfair trading tennis, then there’s one critical factor that you need to understand.
Value betting on Tennis matches
If you are value betting and you want to profit in the long term, you’re estimating what you think the betting odds should be, this is what they are and you would profit from that difference over a long period of time.
Betfair trading Tennis matches
If you are Betfair trading, your profit from price movement. You are saying this is where the market is now, this is where I think the market’s going to be and this is how the odds will change and you will profit from the difference between the two.
However, both of these strategies have a key element to them and that is what should the odds be. In order to be able to understand that, what you need to do is create a odd’s model.
So we are going to explore a betting model for tennis by creating some odds using some publicly available data. This will allow us to either profit from a straight value betting strategy or from a Betfair trading strategy by being able to anticipate where the odds are likely to go.
What do you need to predict the outcome of a Tennis match
When you look at every sport, there is a fundamental underlying characteristic that allows you to define and create some particular model. Models can be as simple or as complex as you wish and can contain a whole number of different factors.
What we are going to address here is the key question of what should the odds be within a tennis match by giving you quite a simplistic example. We’re not going to overcomplicate it, it will be a good start point for you if you want to do this more seriously.
So if we look at a tennis match, we need to identify what characteristic can we use to be able to identify exactly what the odds should be? When you look at each individual sport, you realise that there are factors that are taken into account.
For example, when we look at football/soccer, what you will find is that it is very simple to define what you’re trying to identify within a match. You’re basically saying how many goals are going to scored and how are they going to be divided up between the two teams.
If you work with a model that focuses on that, then you can pretty much predict what the odds are likely to be at any point during the match. Now, I have done videos on this, so watch those if you’re interested in doing this on football, but today we’re going to be focussing specifically on tennis.
So we need to come up with some metrics, a definition of exactly how we are going to price a tennis match. In fact, it’s a little bit easier than you would imagine because all of the publicly available stats are there. You can get them completely free and you can use them to create a model.
Today the metric that we’re going to use is the chance of a player winning a point on their serve. What we need to do is talk that through a little bit, so you get a better understanding of exactly what you’re looking at and how this is calculated.
How to create you tennis betting model
To begin we’re going to use publicly available statistics and then convert that data into a set of odds.
So where do you find these statistics?
If you go onto the ATP and WTA websites, you will see a stats section. If you look at that stat section you can actually examine all of the players together and rank them or you can explore individual player statistics.
If you want to pull this data in automatically
These are some statistics above that I brought up on a player on the ATP website and you can see things like the first-serve percentage, how many points they won on first serve return data and their breakpoints.
Your model can include all of it or just a little part of it. That’s up to you what level of depth you want to go into, but today we’ve created a simple model here that just uses part of this data to come up with some pretty accurate results. So let’s have a look at how we have constructed that using this particular data.
Doing the maths…
| ~ First serve in = 62 (out of 100) – Wins 79% of 62 = 48.98 |
| ~ Second serve points won = 57% – Wins 57% of 38 = 21.66 |
| Total = 70.64% |
So on this particular data, what we’ve done is we’ve taken the first serve percentage and said that 62 times out of 100 serves that first serve will go in and therefore the returner will have to return that and play a shot.
But of course, that means that 38% of the time that first serve didn’t go in. So this particular player, when they serve 62% of their first serves, actually go in and then that particular point is played.
Now, of that 62%, they actually end up winning 79% of those particular points. So we can actually do a really quick calculation here and say that 62% of the time they win a point 80% of the time and if we combine those two together, we come up with a figure of roughly 49%.
So we can say that when that player does that first serve, they’ll win a point 50% of the time. However, we also have this issue that sometimes they don’t get that first serve in and therefore they have to play a second serve.
When you play a second serve you’ve got to get the ball in or you lose a point. When this particular player plays a second service then the chance of winning that point drops from 79% to 57%. However, we can now use that by saying if they win a point 57 % of the time on the second serve and that occurs 38% of the time, then they will basically end up winning a point at 22 times out of 100 on second serve.
So you can basically add those two together and then you end up with roughly 70%. Therefore, on just slightly over 70% of points this player will win on serve. Now we’ve combined the first serve and the second serve meaning the chance of them winning a point on either and that comes up with about 70%.
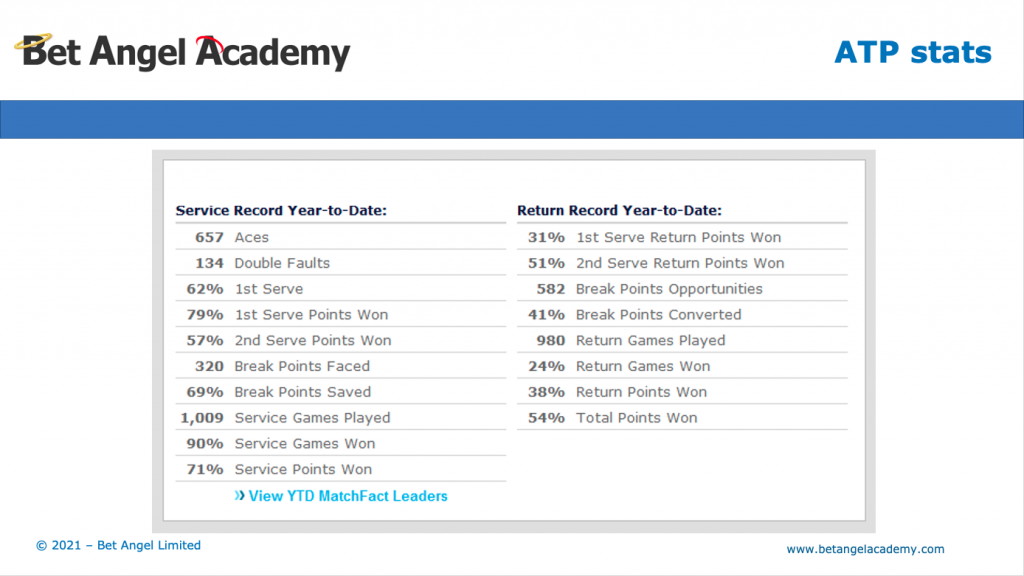
If you want proof that this logic is firm and understandable, just look at those stats. Have a look down towards the bottom of the stats and you can actually see that it says service points one, 71 %.
We have taken the data from the statistics on this website and actually produced and forecasted correctly the outcome of that particular set of services. So you can see how the data is related and that allows you to project forward or backwards based upon stuff that you’re seeing either before the matches started or as the match is actually in-play.
By using some of the statistics that we can see available, we can actually work out the chance of a player winning a point when they stand up and have a serve. This is the key metric that we’re going to use to calculate some of the odds that we expect to see within the Tennis match.
So now that we have that serve percentage, we can actually turn it into some odds. The way that we’re going to do that is we’re actually going to do some simple maths to be able to work this out.
The power of numbers
We know that the player wins a point when they serve about 70% of the time. So we can actually take that and allow us to push forward to create the odds that they will win a particular game. The simplest way to do this is to look at them serving and going 15 love, 30 love, 40 love, game.
So if they can win four points in a row, then they will win the game. We can do that calculation really easily because we know that’s just short of 71% chance of them actually winning a point on serve. Now if we raise that to the power of four, so we’re basically saying 70% chance of winning a serve four times to the power of four and that actually ends up giving us a percentage.
| Average of 6-7 points per game |
| 40-0 =4 serves ~ Single point is 70.64% ~ .7064^4 = 25% =4.00 decimal odds |
So if we do .70, 70% roughly, you can see the exact calculations above at the power of 4 we end up at roughly 25%.
So we’re saying here that the chance of winning a service game to love is about a one in four chance if their chance on winning a point on serve is just short of 71%.
| Winning to 0 | 24.8% |
| Winning to 15 | 29.2% |
| Winning to 30 | 21.5% |
| Winning to deuce | 15.2% |
| Winning the game | 90.8% |
Then you can repeat this calculation for winning a game to 15 to 30 to Deuce and so on. You can actually iterate at this calculation for all of those different scenarios and then you can basically add all of those up. Then that actually says that the chance of this player actually winning a service game is about 90%.
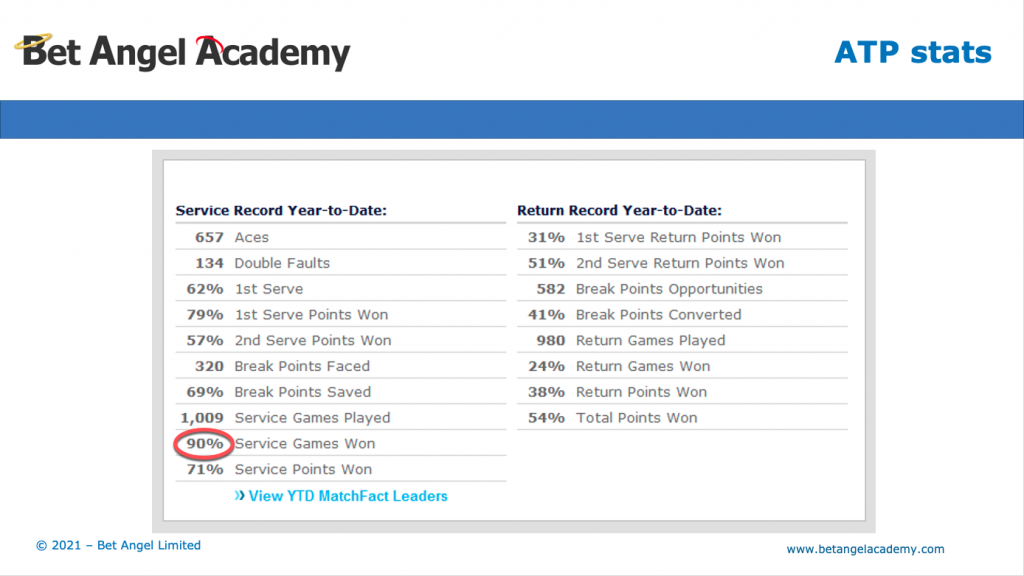
So let’s go back and have a look at the statistics that we saw before. If you actually look on the ATP website, you can see there is a section on there that says service games won 90%. So can you see how this is all tying together beautifully?
We can actually see from the statistics how they are likely to play the game. We can work out from that the chance of them winning a point on serve and then we can use that to work out the chance of winning again.
So you can see the logic is there. When you know the percentage chance of them winning a game, then you can convert that into decimal odds, which will give you the overall odds that you see on the screen in front of you.
Once you work out the chance of them winning a game, then you can work out the chance of winning a set, once you work out the chance of winning a set, then you can actually work out the chance of them winning a match, all from that very simple statistic.
The simple tactic you may not know about…
If you’re going to roll these calculations out across an entire match it gets very complicated because you’ve got hundreds of points, you’ve got scores of games and loads of scenarios that could happen like tiebreaks etc. From this point onwards putting your statistics into a model to actually output some odds can become difficult.
However, if you’re a Bet Angel customer, you don’t need to worry because it’s all available for you!
If you go into Bet Angel professional and you click on the tennis ball icon, you bring up Tennis Trader which is an industrial grade modelling tool for tennis. So if you work on any stats, you can put them into Tennis Trader and it will output the odds for you will do all of the hard work for you.
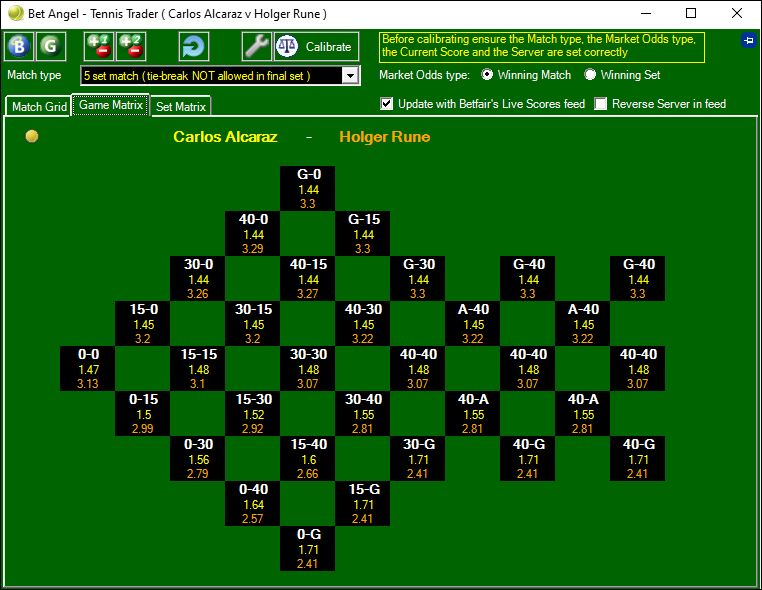
If this was a separate product to be sold into Bookmaker’s, it would sell for a lot of money! However, you get it completely for free within Bet Angel, so let me explain how he would use it in this particular circumstance.
Putting it into practice
For this example you don’t need to worry about the specifics of the tennis match that I’m using, but to start what you will need to do is select what type of match it is. For this example I’m doing a three set match with a tiebreaker allowed in the final set.
Then what I’m going to do is go onto the calibration setting and here you can enter the percentage chance that a player wins on serve. So if we have two players and one of them is priced, we’ve got this set at 62 and 66. If I apply that to the model, it will actually come up and price what the market will be.
We can also adjust this to sort of indicate if it was a much closer than we think, they’re much more equally matched. You can see that it will price that as well in the image below.
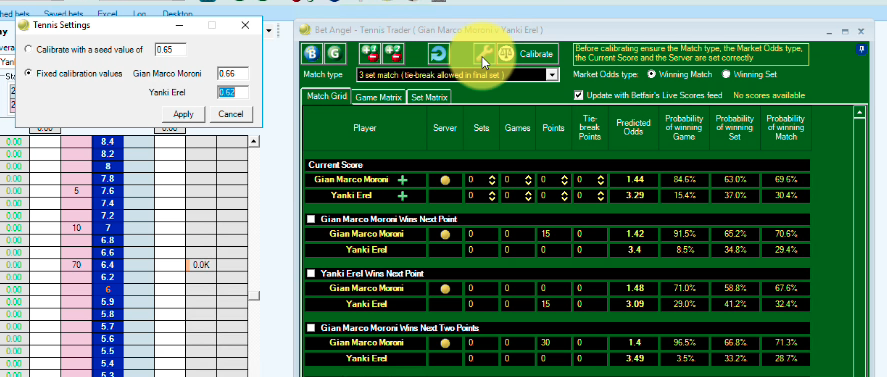
Now perhaps you’ve got one player that is much stronger than the other, you can change that in Tennis Trader as well.
Of course, you can do it the other way around, if you want to figure out what the market is telling you and you see a set of odds, as long as you make sure you set the match type correctly, you can actually go in and get an understanding of exactly how strong markets thinks one player is against another. Then you can take a value position against that or a trading position.
The game matrix
Another interesting area you can look for is the game matrix. Here you can actually put in the two values because you obviously need one player against another. You would put in the value against both of these players and then it will actually be able to project out exactly how that is going to play out over the course of a game and over the course of a set.
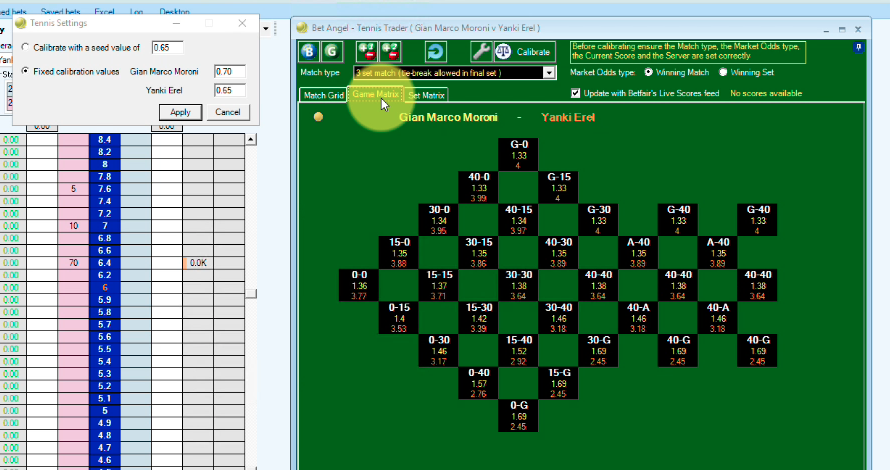
So tennis trader does all of this for you, you fiddle around with the core values within the model and then Tennis Trader will actually pump out the odds for you. You don’t need to do any of the complicated calculations that go behind that, avoiding the stress from all the maths!
Make it personal to you
Additionally, if you go into the match grid, then you can actually define custom scores. You can begin to look at particular areas within the match that may interest you. Then you can start to fiddle around with the data here and see how that is likely to influence things and what will happen within the match and how that influences the likely outcome.
This is really beneficial from a trading perspective, because as the match progresses, you can then begin to understand what the market’s telling you, whether it’s discounting information into the service game of each or both players.
You can also use it from a value perspective, by adjusting these values here, you can actually come up with the odds that you should expect to see for the entire match. So if you’re having a bet before the match is underway, you can use the Tennis Trader model to predict and understand what the predicted odds will be based upon any of the statistics that you’re using or that you’ve collated.
So if you want to understand how to create tennis models that is roughly how you would do it. There is a lot more detail you can go into if you wish, but if you want to play around with that and you want to see the impact that your statistics will have on the outcome of match, then you have the perfect tool in Bet Angel called Tennis Trader.
It will allow you to do exactly that without any of the hard work that you’d have to do if you had to create your own model.
Anyhow, I hope that this blog post has been useful for you and explained how we have been able to successfully create and understand how to create a betting model for tennis markets.
Check out Tennis Trader on Bet Angel here! https://www.betangel.com/tennis/
The post Creating a Tennis Trading Model – Tips and Tricks appeared first on Betfair trading blog | Expert advice from Professional Betfair trade.
